Dmitrijus Semionovas
Jes Kristian Joergensen
Our task was to create and test a photometric system suitable for recognition and classification of white dwarfs. This system had also to be applicable for the classification of the main sequence stars.
As a starting point we assumed the interferometric variant of Vilnius
photometric system, which was then ajusted and expanded to suit our purpose.
To locate spectral bands, suitable for WD classification we used
the ESO collection
of spectrophotometric standards. Restricting ourselves to the wavelenghts
suitable for the ground observations we chose to use 5 filters (W, P, X,
Y, V) from the Vilnius photometric system (W and Y parameters were changed)
and to employ 2 additional filters, E and Hb.
|
|
|
|
|
|
|
|
|
|
|
|
|
|
|
|
|
|
|
(A) |
|
|
|
|
|
|
|
The reason of the choice of filters was as follows: W, P and X are used to measure the height of the Balmer jump. This is an effective measure of temperature for normal stars and it also can be used to recognize DA stars, which are the only white dwarfs with recognizable Balmer discontinuities. The P filter may be used as a pressure gradient gauge. Y filter presence was desirable due to its position of the knee of interstellar extinction law, so that it could be possible to employ the reddening correction procedures designed for Vilnius photometric system. The V filter is used for both temperature calibration and magnitude calibration for transformations between the systems. After some experiments Y filter position was shifted to the from 4660 A to 4600 A to avoid influence of H lines.
Two additional filters, E and Hb were chosen to monitor presence of He and H spectral lines, being positioned at HeI/HeII lines at 4480 A and H beta at 4859 A. All our filters were simple box functions which would not practically (and preferable in terms of the selectivity as the peak of the response curve carries more statistical weight that the wings) be the case.
We then created a small Fortran program, which read these spectra and calculated magnitudes in each filter normalized to the spectra of Vega. More precisely: For each filter the fluxes at the given wavelengths were summarized divided by the total number of measurements to make an average flux in the given filter and from this we calculated the magnitudes in the filters. With these given it's a simple task of subtraction to find the color indices, which could then be plotted in a color-color diagram.
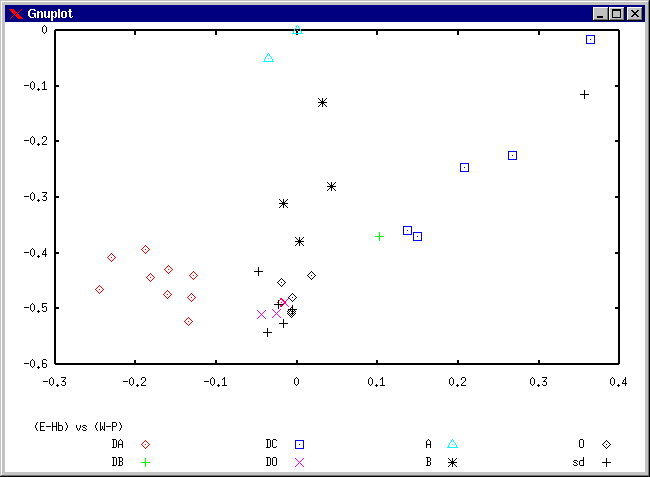
As a primary color difference we chose temperature-dependent (Y-V). The following 5 color-color magnitude diagrams were used:
The example of those color diagrams is shown below.(Y-V) vs. (Y-Hb),
(Y-V) vs. (X-V) - (W-Hb),
(Y-V) - (E-Hb) vs. (Y-V) - (W-P),
(W-P) - (Y-V) vs. (W-Hb) - (X-V),
(E-Hb) vs. (W-P)

Fig. 1. Example of the color-color diagram.
The other point one might consider is whether these sequences corresponds to physical magnitudes. For A dwarfs this seem to be the case. If one considers the diagram in appendix B one notices the 3 dwarfs located in the lower part of the diagram. In the full diagram these are actually the ones that mixes with the main-sequence stars and O dwarfs. Again if one considers the spectra of these one notices that the spectra of these 3 dwarfs (appendix D) one notices that compared to the spectra of one of the "normal" A dwarfs it has almost no features in terms of hydrogen lines - so the sequence in A dwarfs in this diagram actually corresponds to a sequence in temperature.
The most problematic was the classification of subdwarf stars, that were spread over most of the diagram phase space. This task could have been accoplished using one of standard methods of Vilnius photometric system (probably requiring inclusion of other filters from this system). It seems unlikely to distinguish between DB and DO white dwarfs using only wavelenghts accessible from the ground, as the far UV band carries a significant part of those stars spectral information.